Home
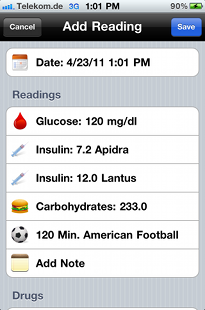
DiabetesPlus gives you the possibility to administer your blood glucose (mg/dl and mmol/l), your dosage of insulin, carbohydrates, sport activities and notes in a simple and fast way.
DiabetesPlus saves your time with its easy-to-use interface and an export functionality, which generates all your diabetes documentation in less than 30 seconds.
DiabetesPlus is reccommended by the Diabetics Center Hamburg West
Functions
- Administration of measurements: blood glucose (mg/dl and mmol/l), dosage of insulin, carbohydrates, sport activities and notes
- Define your glucose target range
- Clear illustration due to coloured indicators
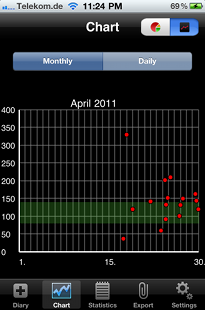
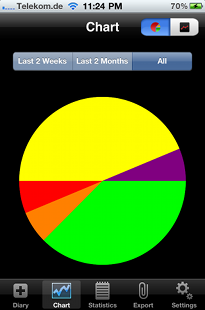
- Graphical reporting of target values
- Calculation of important statistics (average blood glucose, HbA1c, average dosage of insulin (short and long acting insulin), average carbohydrates)
- PDF-Export designed like the known diabetes diarys
- Email pdf to your doctor or to you to print it
- Enhance the report with your personal data (name, date of birth)
- Selection of your insulines (short and long acting) in settings
FAQ
Can i delete wrong entrys?
To delete wrong entities, you have to wipe horizontally over the entry. This will trigger a “Delete”-Button. Pressing this button will finally remove the entry.
Can i delete a single reading within an entry?
You can wipe horizontally over the reading (Glucose, long-acting-insuline, short-acting-insuline, sport and notes), which will trigger “Delete”-Button. Pressing this button will finally remove the single reading. After that, the reading can be reentered.
Can i add entrys afterwards or can i change the date of an existing entry?
You can just click the date row in the detailview of an entry. A picker will appear, so you can change the date to any value in the past.
Your question was not asked?
If you have further questions, just write a message with our Contactform. We will answer your question as soon as possible.
Screenshots
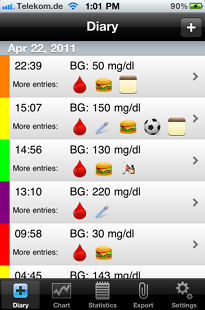
The icons an each entry directly indicate the saved readings. The coloring on the left side indicates the target ranges of the glucose value.
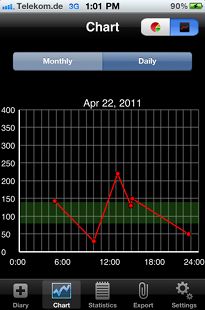
You can also see the target range inside you graph, so can easily se which values are fine and which should be better.


Clicking the export button will generate the pdf-export and opens the mail view.
Users with iOs 4.2 or higher can use the Print-Button to print the export directly on their AirPrint-printer.
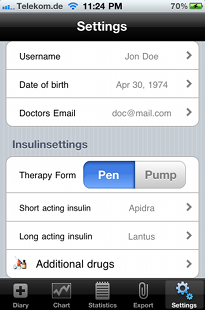
You can set your insulines and if you use an insuline-pump, the basalprofile will be set here.
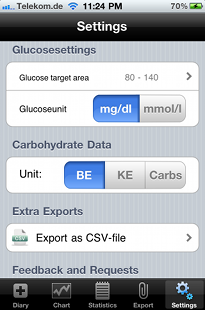
DiabetesPlus gives you the possibility to enter meals in 3 different units. Users which like to make their own excel exports, all entrys can be exported to a csv-file here.

